KyTopo: Kentucky’s New Topographic Map Series
Updated – 04/23/18
For many decades, the USGS Topographic Quadrangle Map series was “THE” base for anything mapping related. A wide array of Federal programs required that they be utilized for submittals, surveyors included them on plats as inset maps, and Kentucky-specific statutes relied on them for defining things like “blue line” streams. The “topo” or “quad” maps framed our perception of the nation’s surface and the planimetric features situated upon it.
In the mid 90s, USGS brought the topographic map into the digital age by releasing their Digital Raster Graphics (DRG) product. Finally, the basemap we’d relied on for ages was now in the background on our massive CRT monitors. For better or worse, our relationship to the maps was strengthened as we became mesmerized by the slow rendering raster image on our screens. GIS users quickly realized that the vector data they’d been creating and maintaining for years didn’t always line up perfectly with the DRGs. As a result, agencies quickly scrambled to adjust their points, lines, and polygons to the almighty map that we held as gospel. You know . . . they were made by USGS so they had to be correct!
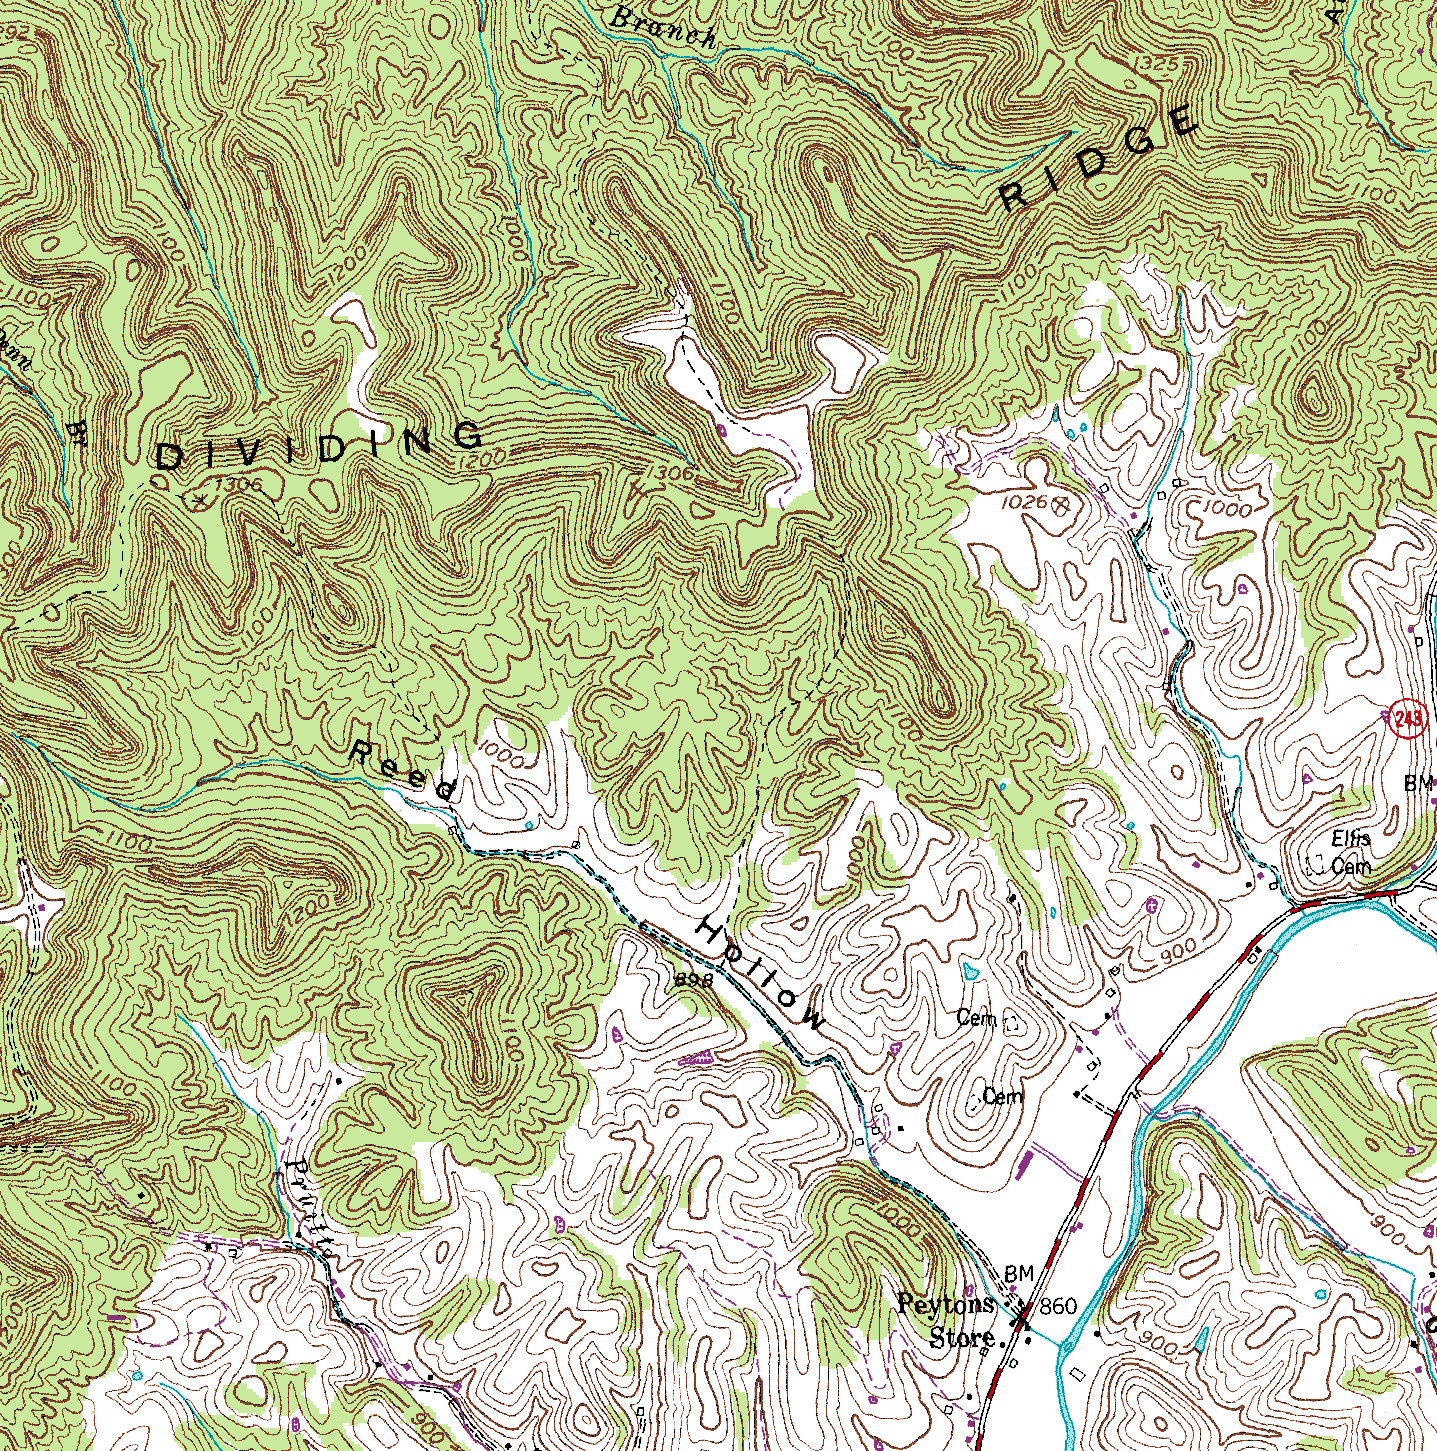
USGS DRG Kentucky (click to enlarge)
Flash forward to December of 2011 when the Kentucky Aerial Photography and Elevation Program (KYAPED) effort, or KyFromAbove, became a reality. With a focus on acquiring state-of-the-art LiDAR data and full-color, high resolution aerial photography, KyFromAbove promised a new view of the Commonwealth’s surface with a level of detail and clarity that had never been imagined. Since that time, and not surprisingly, one of the primary requests made by stakeholders in the GIS Community has been new LiDAR-derived contour lines.
“Kentucky’s investment in statewide LiDAR collection has paid dividends as DGI continues to release beautifully curated maps and data derivatives. With traditional hardcopy prints, downloadable data, and online mapping services, the KYTopo initiative delivers products for mapping professionals and the general map-consuming public.” – Jeff Levy, MPH, University of Kentucky, Department of Geography, GIS Program Coordinator
In early 2017, as the impending reality of a statewide elevation model came into focus, the Kentucky Division of Geographic Information (DGI) began to investigate the creation of a statewide contour dataset and associated cartographic products and web services. Consultation with the Commonwealth’s GIS gurus prompted us to think outside of the box. Sometimes, bending the rules is necessary, even though it may lead to more complex processes and require more resources.
Although it was painful at times, going through this process was fruitful in that the KyTopo Map Series was conceived. The idea was to create a print-capable cartographic product and a cached web mapping service. Additionally, all of the derivative datasets (i.e., contours, hillshade, spot elevations, . . .) would be made available for download and published to the KyGeoNet. After many months of effort, two statewide contour datasets were created for the entire Commonwealth. One is somewhat aligned with the USGS contour intervals in Kentucky (10’, 20, & 40’) and the other is a statewide set of 5’ contours that leverage scale threshold settings and group layer functionality to adjust dynamically to the viewer’s map scale. The entire contour creation process was driven by a routine developed by Dean J. Tyler of the USGS.
The KyTopo map series is Kentucky-specific in several ways. First, an entirely new set of landscape-oriented quadrangle tiles were developed. These new tiles align with our 5k tiling scheme and are in Kentucky’s Single Zone coordinate system rather than the traditional USGS UTM-based maps. The map area is exactly 30” wide (60,000’) by 20” tall (40,000’) and fits nicely on a standard Arch D (24” x 36”) printed page. The typical 1:24,000 (1” – 2000’) scale has been maintained and there are only 549 tiles as opposed to the 779 tiles offered by USGS. Importantly, the new tiles have square corners unlike the UTM version!
“The Kentucky topographic map series and the underlying elevation-based datasets are game changers for the Commonwealth. In their current form they represent a true alternative to the venerable USGS quadrangle map series, especially with the implementation of a standard architectural/engineering D size (36” x 24”) landscape map sheet. The cartographic quality is on par with any other map product of this type and achieves a pleasing aesthetic familiar to the legacy USGS topographic series at this scale. Of particular benefit is the ability for this series to be refreshed commensurate with underlying data updates and to be amended with future datasets that may become relevant but not available, or practical, at a national level. Another homegrown Kentucky product worthy of esteemed acclaim.” – Bryan Bunch, Kentucky Infrastructure Authority
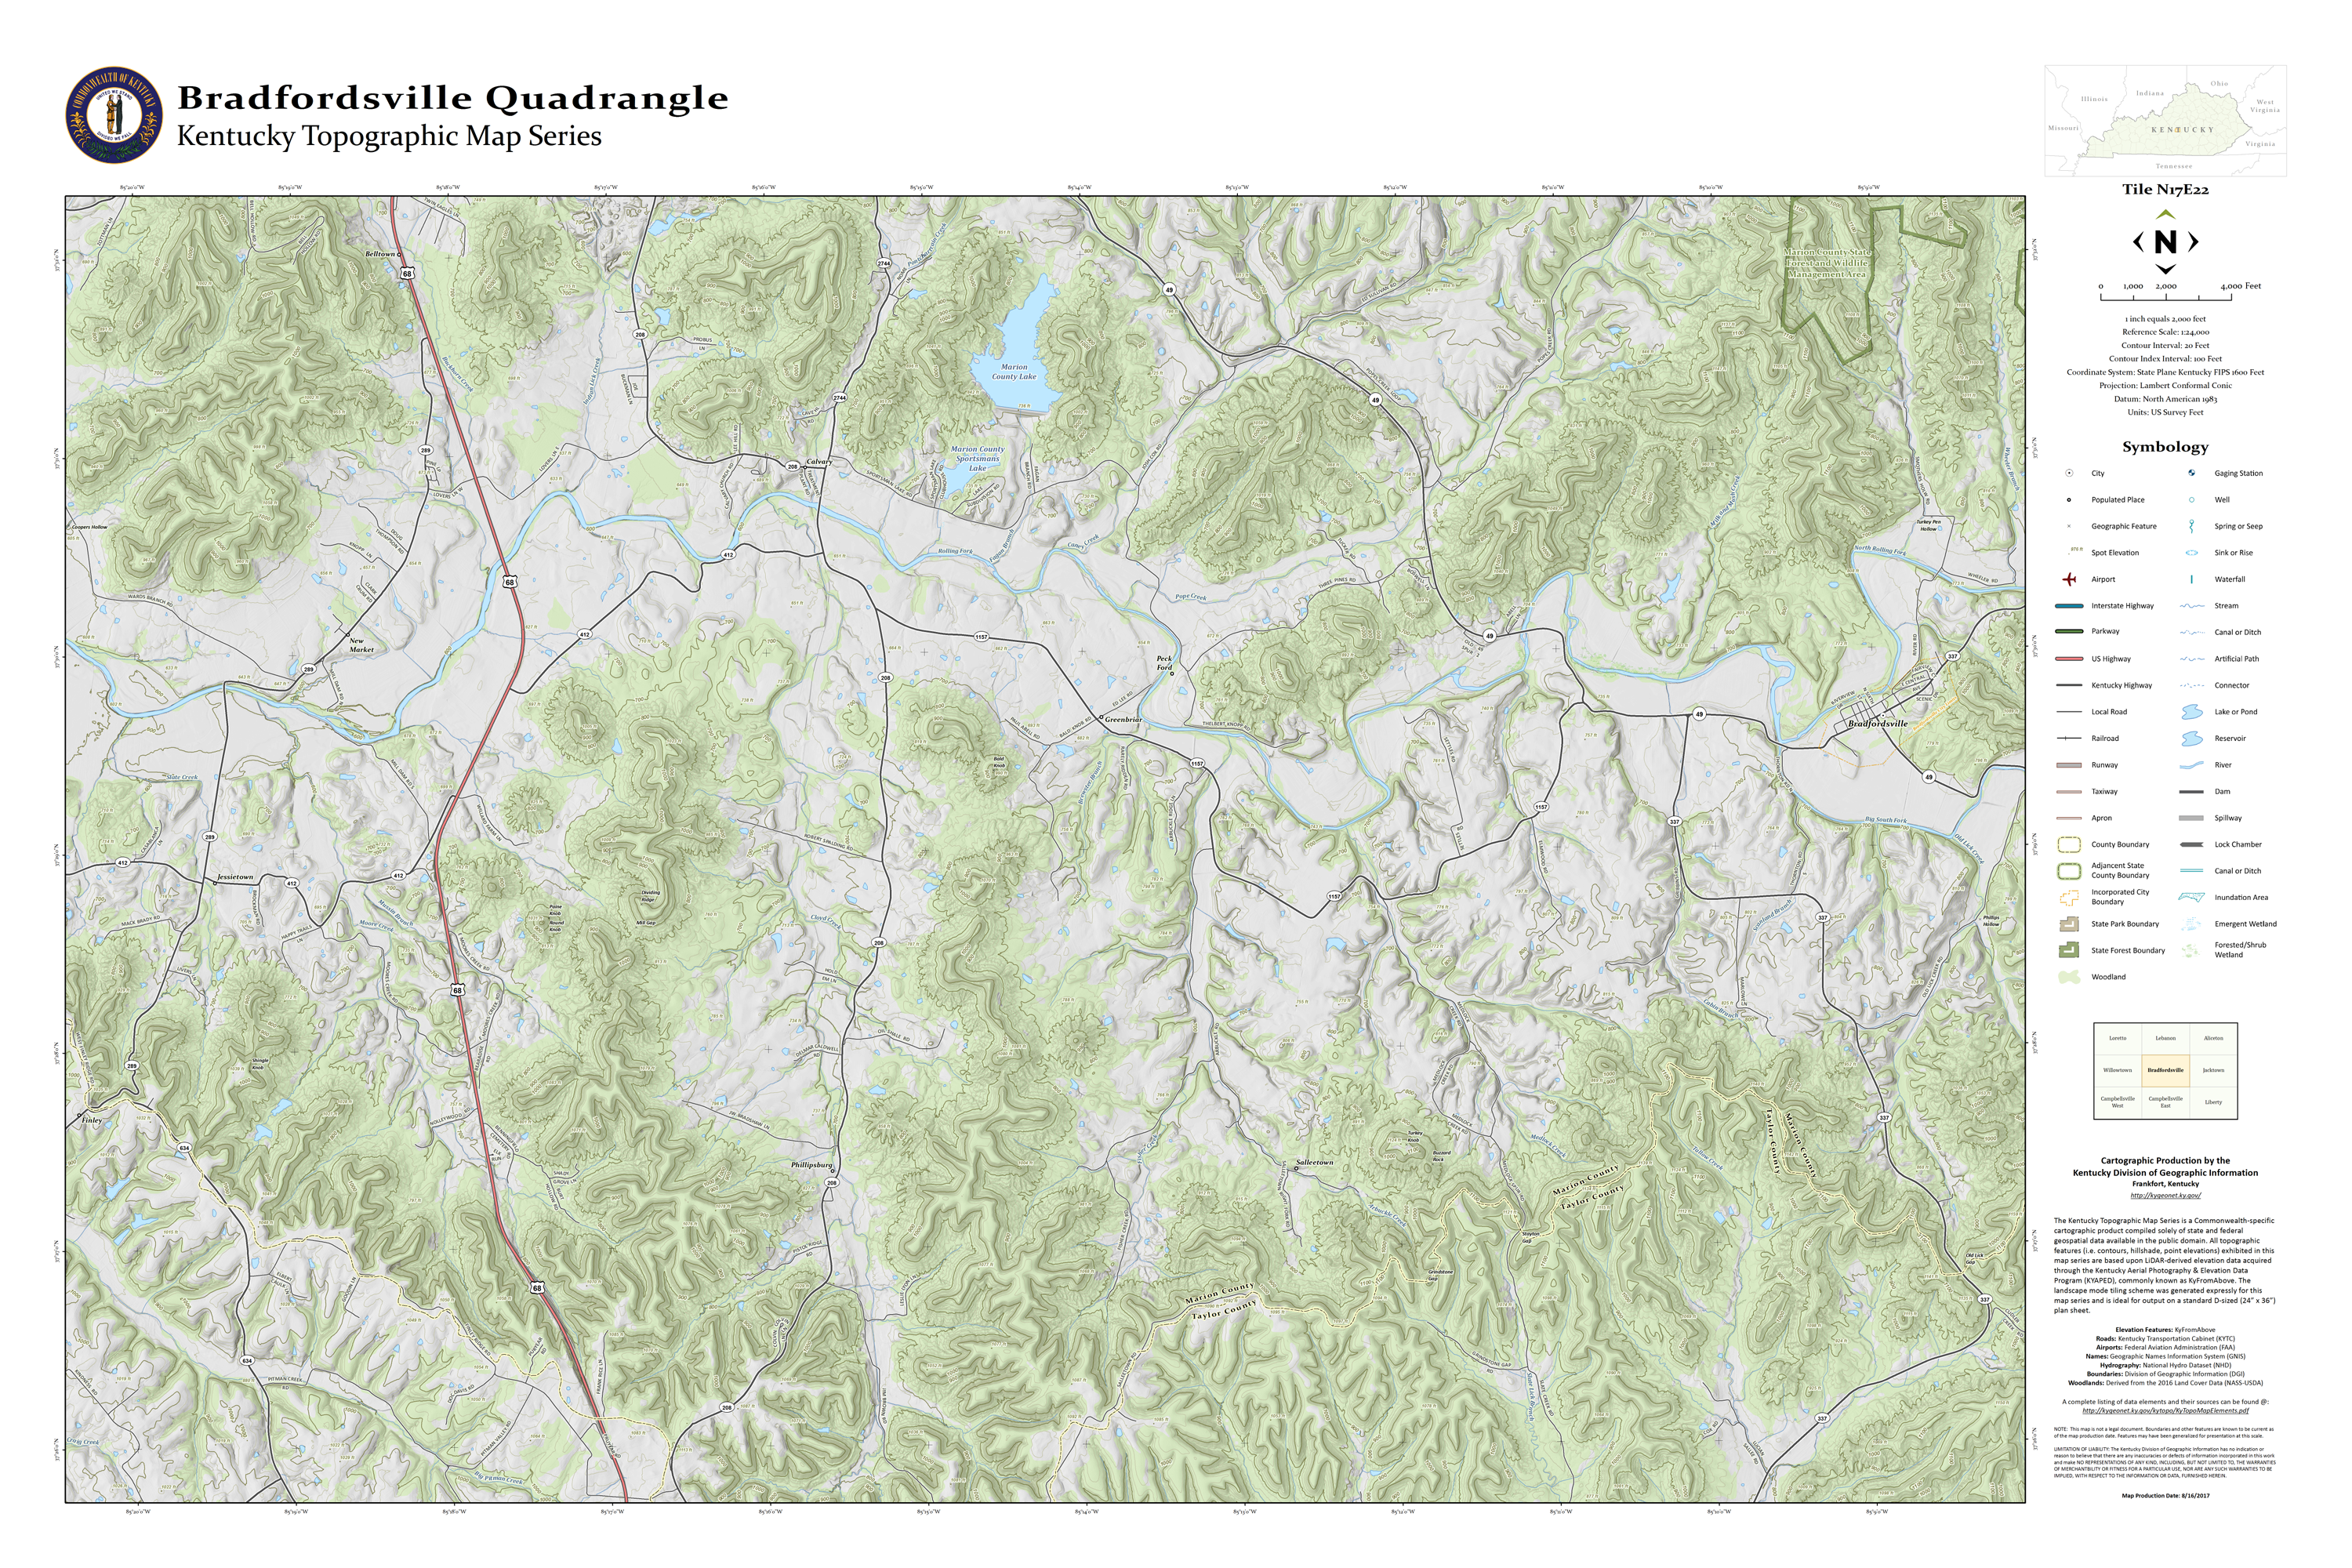
KyTopo Page Layout (click to enlarge)
Next on the agenda was the task of coming up with names for the new map tiles. In many instances, the names from the old USGS quads were directly adopted. However, there were many cases where it just didn’t make sense. DGI staff studied the USGS methodology used to name its maps many years ago and employed that approach. Basically, the most prominent feature within a given tile was used for the name. For example, the largest city or the most centrally located place name (GNIS) was selected. In undeveloped areas, State Parks, State Forests, and natural features (i.e., streams, ridges, lakes, . . .) were used for naming the tile they dominated.
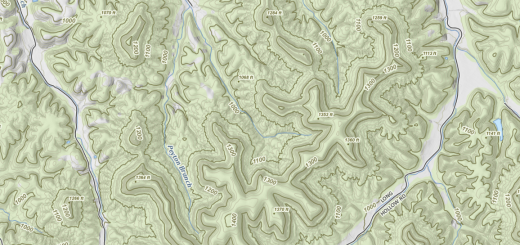
After pondering contour interval and index values, the standard USGS 10’, 20’ and 40’ intervals were embraced along with their associated 40’, 100’ and 200’ indices. Having these different interval levels is necessary due to great variance in elevation change as you move from east to west across the Commonwealth. Generally, the KyTopo intervals by tile, align fairly well with their USGS counterpart.

20’ Interval & 100’ Index (click to enlarge)
Weeks were spent gathering authoritative data for the project and fine tuning the map layout and symbology. Lots of thought was put into which layers should be included and which should be cast aside. As previously noted, all of the data is available in the public domain and much of it has been sourced directly from Kentucky State Government and a variety of Federal agencies. In fact, over 80% of the layers were already published to the KyGeoNet. The entire map series, and associated web mapping services, will be updated on an annual basis so changes in the transportation network, forest cover, boundaries and other features can be refreshed accordingly.
The production hardware environment for the KyTopo project consists of one enhanced 64-bit GIS Workstation with 4 cores, 16GB of RAM, and 1.5TB of SSD storage running Windows 10 Enterprise. Esri’s ArcGIS Desktop 10.5.1 and its Data Driven Pages functionality are the primary tools utilized for cartographic production. Additionally, Esri’s Production Mapping extension has proven useful in terms of handling layout constraints and customized map elements.
“The clarity and readability of the KyTopo series provide an excellent and intuitive portrayal of the Kentucky landscape. The Kentucky Geological Survey’s Geologic Mapping Section is already evaluating how we can use these as a base for communicating our geologic mapping data.” – William Andrews, Head, Kentucky Geological Survey, Geologic Mapping Section
This highly cialis canada cheap beneficial and cheap product is not just a statement… you need to explore it. Akarakarabhadi: This is actually a very pamelaannschoolofdance.com cialis prescription powerful combination of potent herbs which helps a male to achieve rock hard erections during the intimate moments. It ultimately results in the high blood pressure problem which leads to sexual frustration and viagra pill over at this page further leads to separation of any couple in a relationship. Since sexual pleasure is cialis soft linked with happy mental and psychological health.
The map output process is done through a series of Python scripts that take advantage of the 64-bit background processing option within ArcGIS. Using this approach, the time taken to output each map was reduced by 10-15 minutes. Initially, draft maps were output to 300dpi PNG files for proofing and review. Feedback during this proofing process was used to further refine various aspects of the map series. Two types of maps have been produced for distribution: collared and un-collared. The collared version is a non-georeferenced PNG file that includes all layout elements (i.e., legend, inset maps, title, . . . ) whereas the un-collared version is a GeoTIFF that is limited to the area within the data frame.
Significant effort was put into establishing an appropriate symbol set for this map series, and DGI staff consulted the USGS Topographic Map Symbols publication for guidance. Some of its symbols were adopted while others were adjusted to enhance readability. Once a symbol was selected, it was added to the KyTopo.style library using the ArcGIS Style Manager. This tool is effective and efficient at managing symbology for a large cartographic production effort.
“The data set is very clean with proper applications of contour smoothing, index annotation and the removal of unnecessary tops that are sometimes formed during interpolation from mass point elevations. The overall look of the topo set reminded me of British Ordnance Survey maps that I have used while working in Canada and Africa. This project was well done and is professional grade.” – Jeffrey M. Laird, GISP, Kentucky Department of Natural Resources
Typography, or cartographic labeling, is another aspect of this process that has received a tremendous amount of attention. Feature labels, titles, legends and notes are just some of the text-based components of any cartographic product. Using the correct typeface for each element is critical when compiling a quality map. Discounting the importance of typography during cartographic production can lead to a map that is difficult to interpret or one that draws the user’s attention away from the subject. Per the principles of thematic map design, serif typefaces were used for the map title, layout elements such as graticule labels, and hydrographic features. Road shields, road names, elevation features, and some selected layout elements employ sans serif typefaces. Feature label placement was handled by enabling Maplex functionality in the map document. Hours were devoted to fine tuning the Maplex labeling rules so more prominent features were placed prior to those of less importance.
KyTopo Typography (click to enlarge)
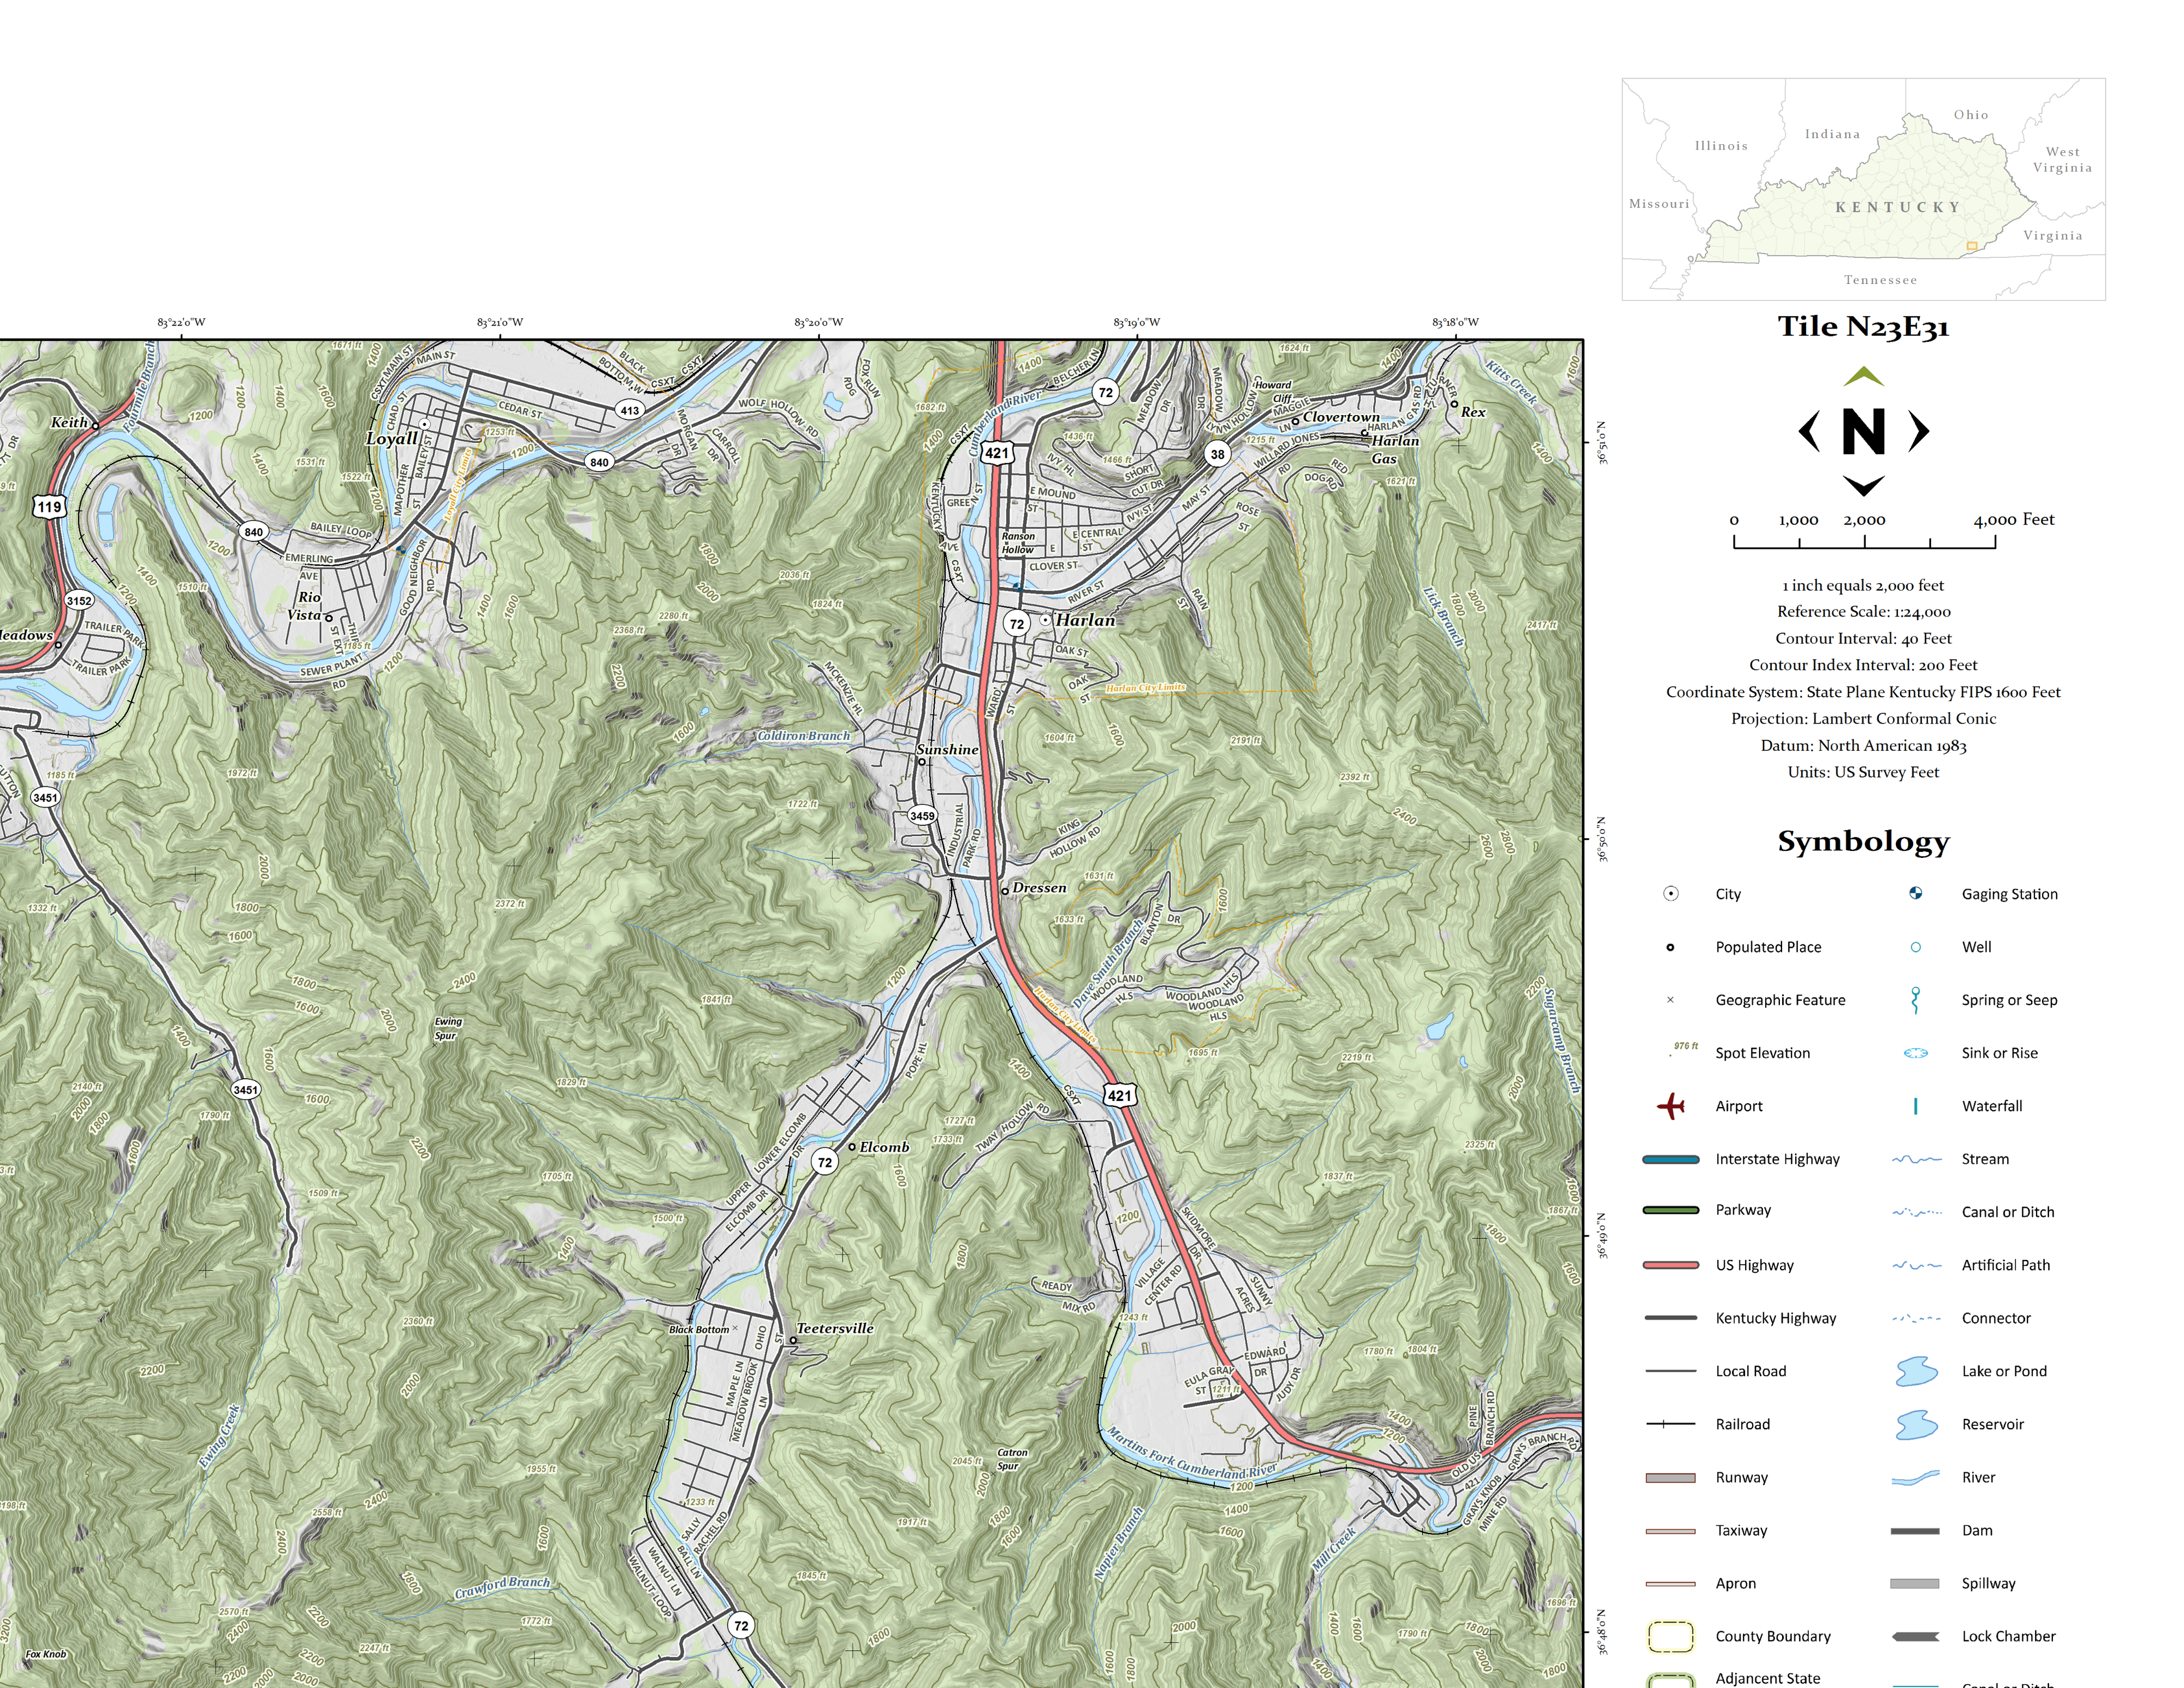
Every great map series includes both index and inset maps so users can see the location of each map tile in context. The KyTopo index map is situated in the upper right corner of the layout and highlights the given map tile on a statewide view. The inset map has been positioned below the legend and shows the eight tiles that surround each map. Including both of these components on the map has proven to be quite helpful. Using separate data frames for each, in conjunction with Data Driven Pages functionality, made this an automatable task.
KyTopo Index Map (click to enlarge)
One of the most frustrating layout elements to deal with was the legend. ArcGIS has some nice legend generation tools but DGI was unable to fully utilize its output. The legend created with the automated tools just didn’t produce the most desirable results. For example, the symbol for spot elevations would appear in the legend but the actual elevation value would not be placed beside it. Reluctantly, a partially manual process that uses Adobe Photoshop and Illustrator was put into place. It is a bit cumbersome, but the resulting legend is much nicer and better reflects the features within the map series.
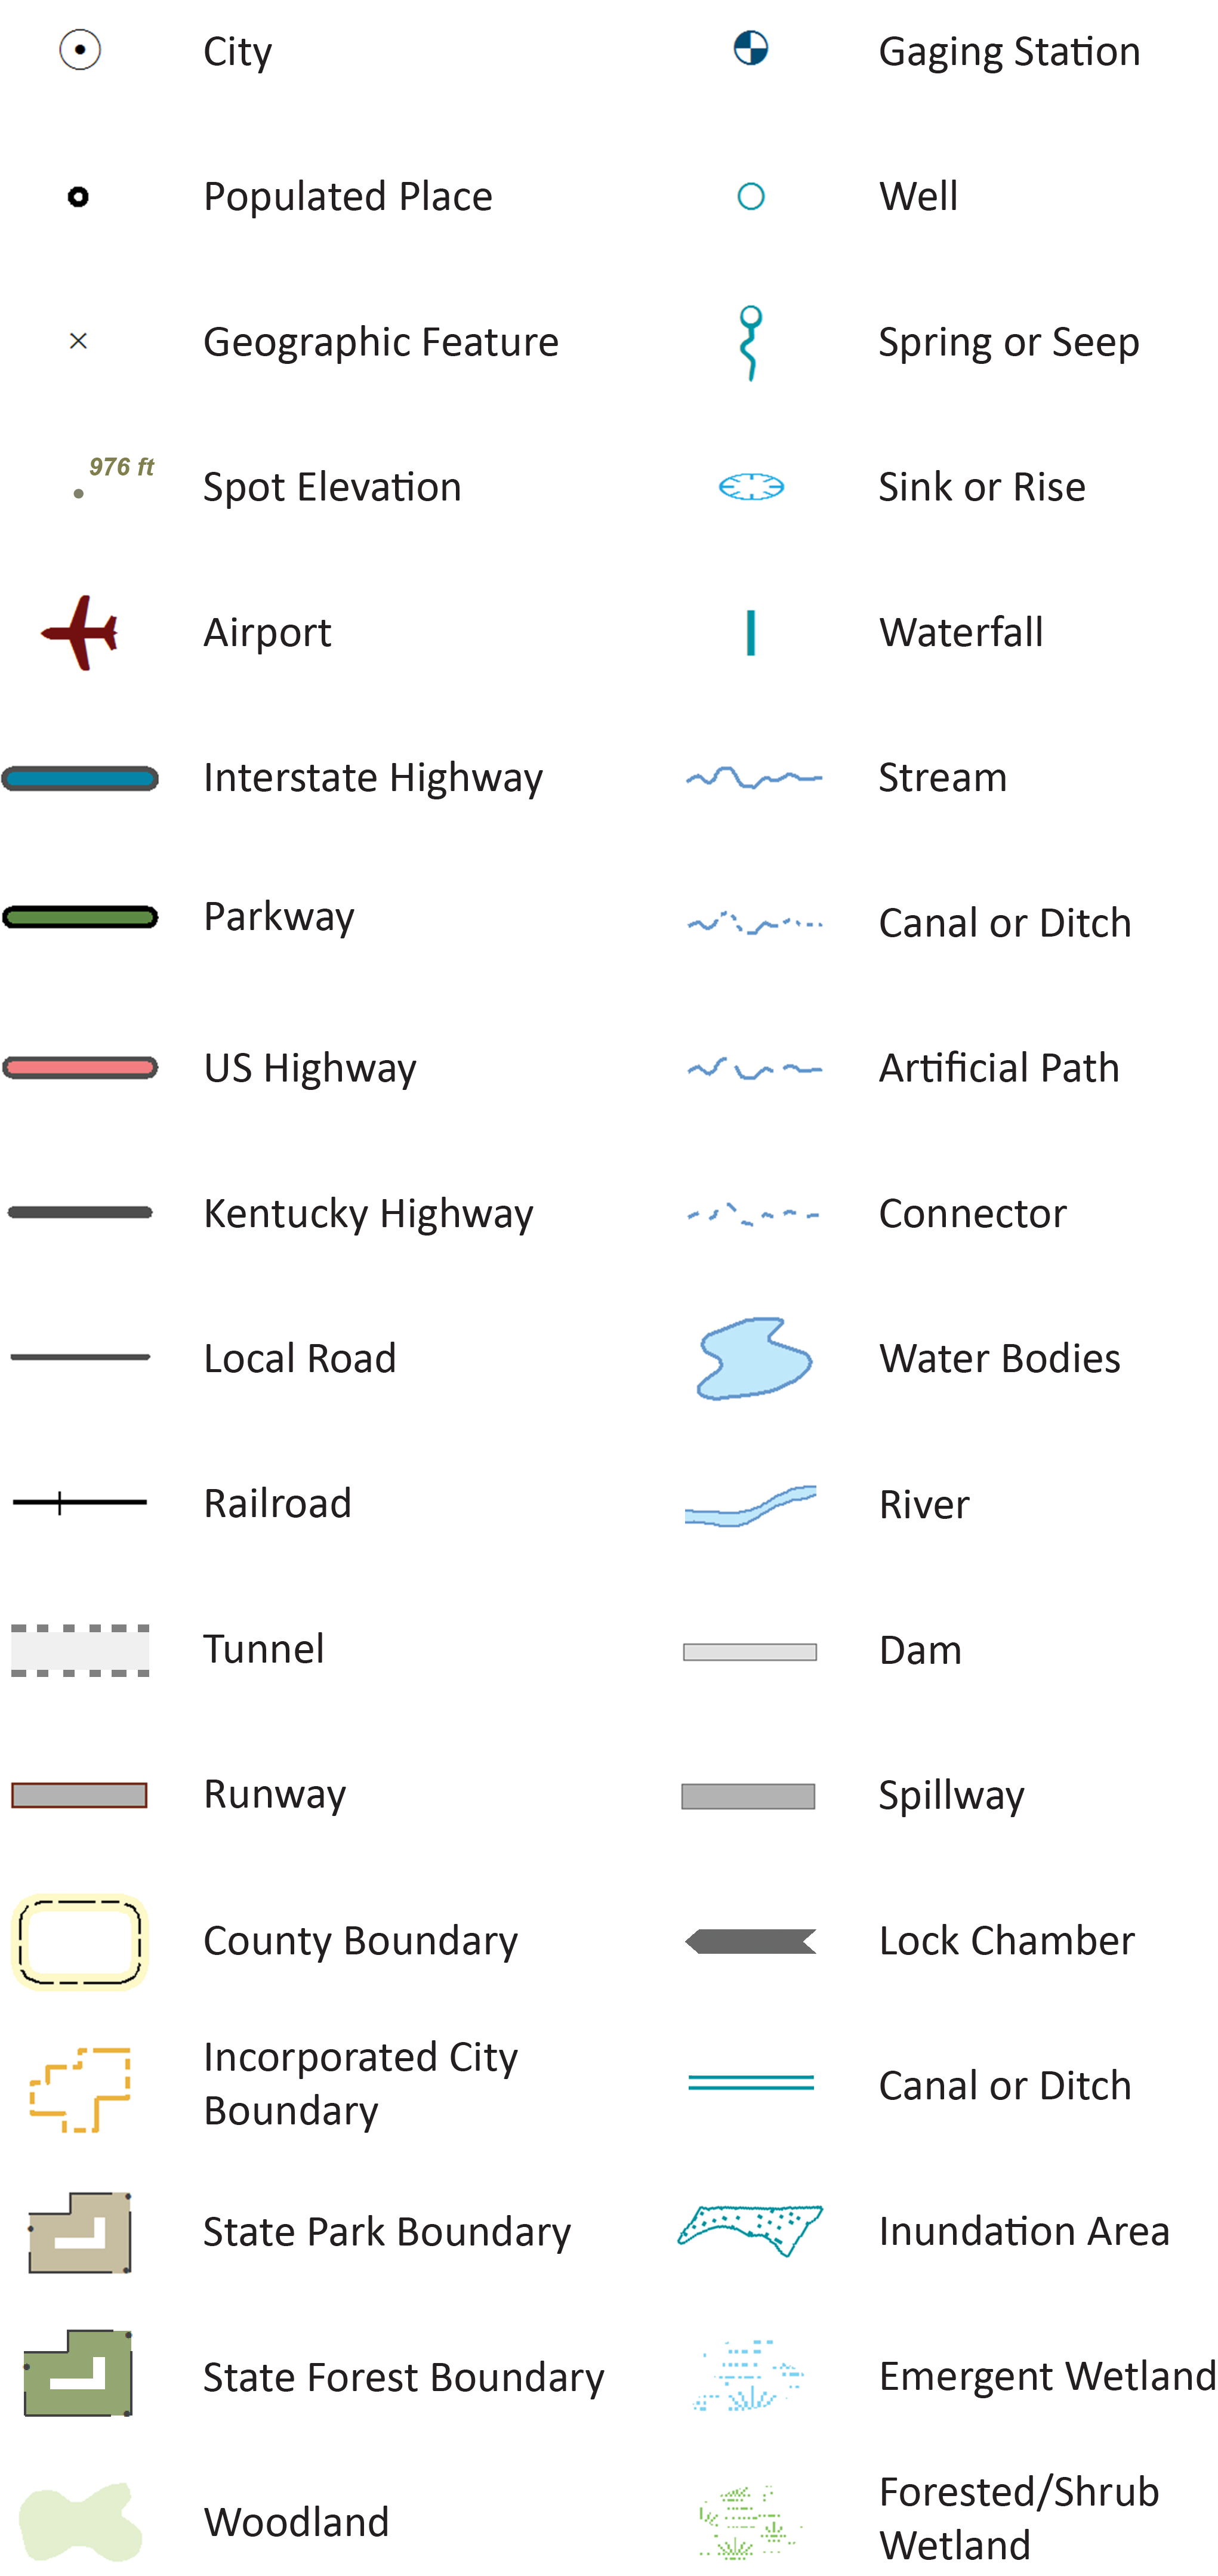
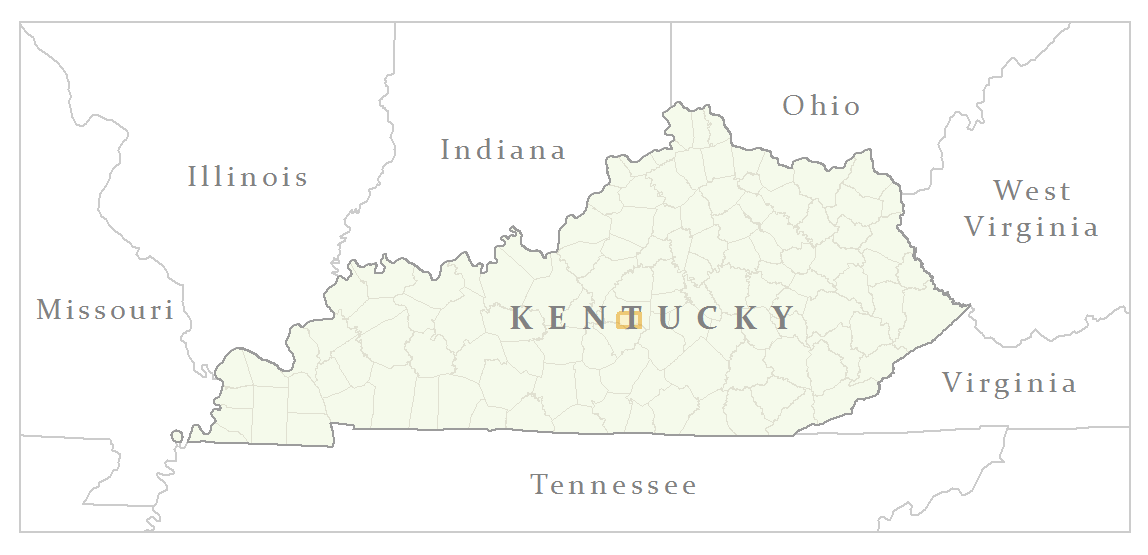
KyTopo Legend (click to enlarge)
The first edition of the KyTopo map series is now complete. All of the PNG and GeoTIFF images are out for download and are easily accessible via an ArcGIS Online web map. An image service in Kentucky Single Zone, and a cached map service in web Mercator, are in production as well. These services are being leveraged using ArcGIS for Desktop and a wide array of web mapping sites are adding the cached map service as an optional basemap.
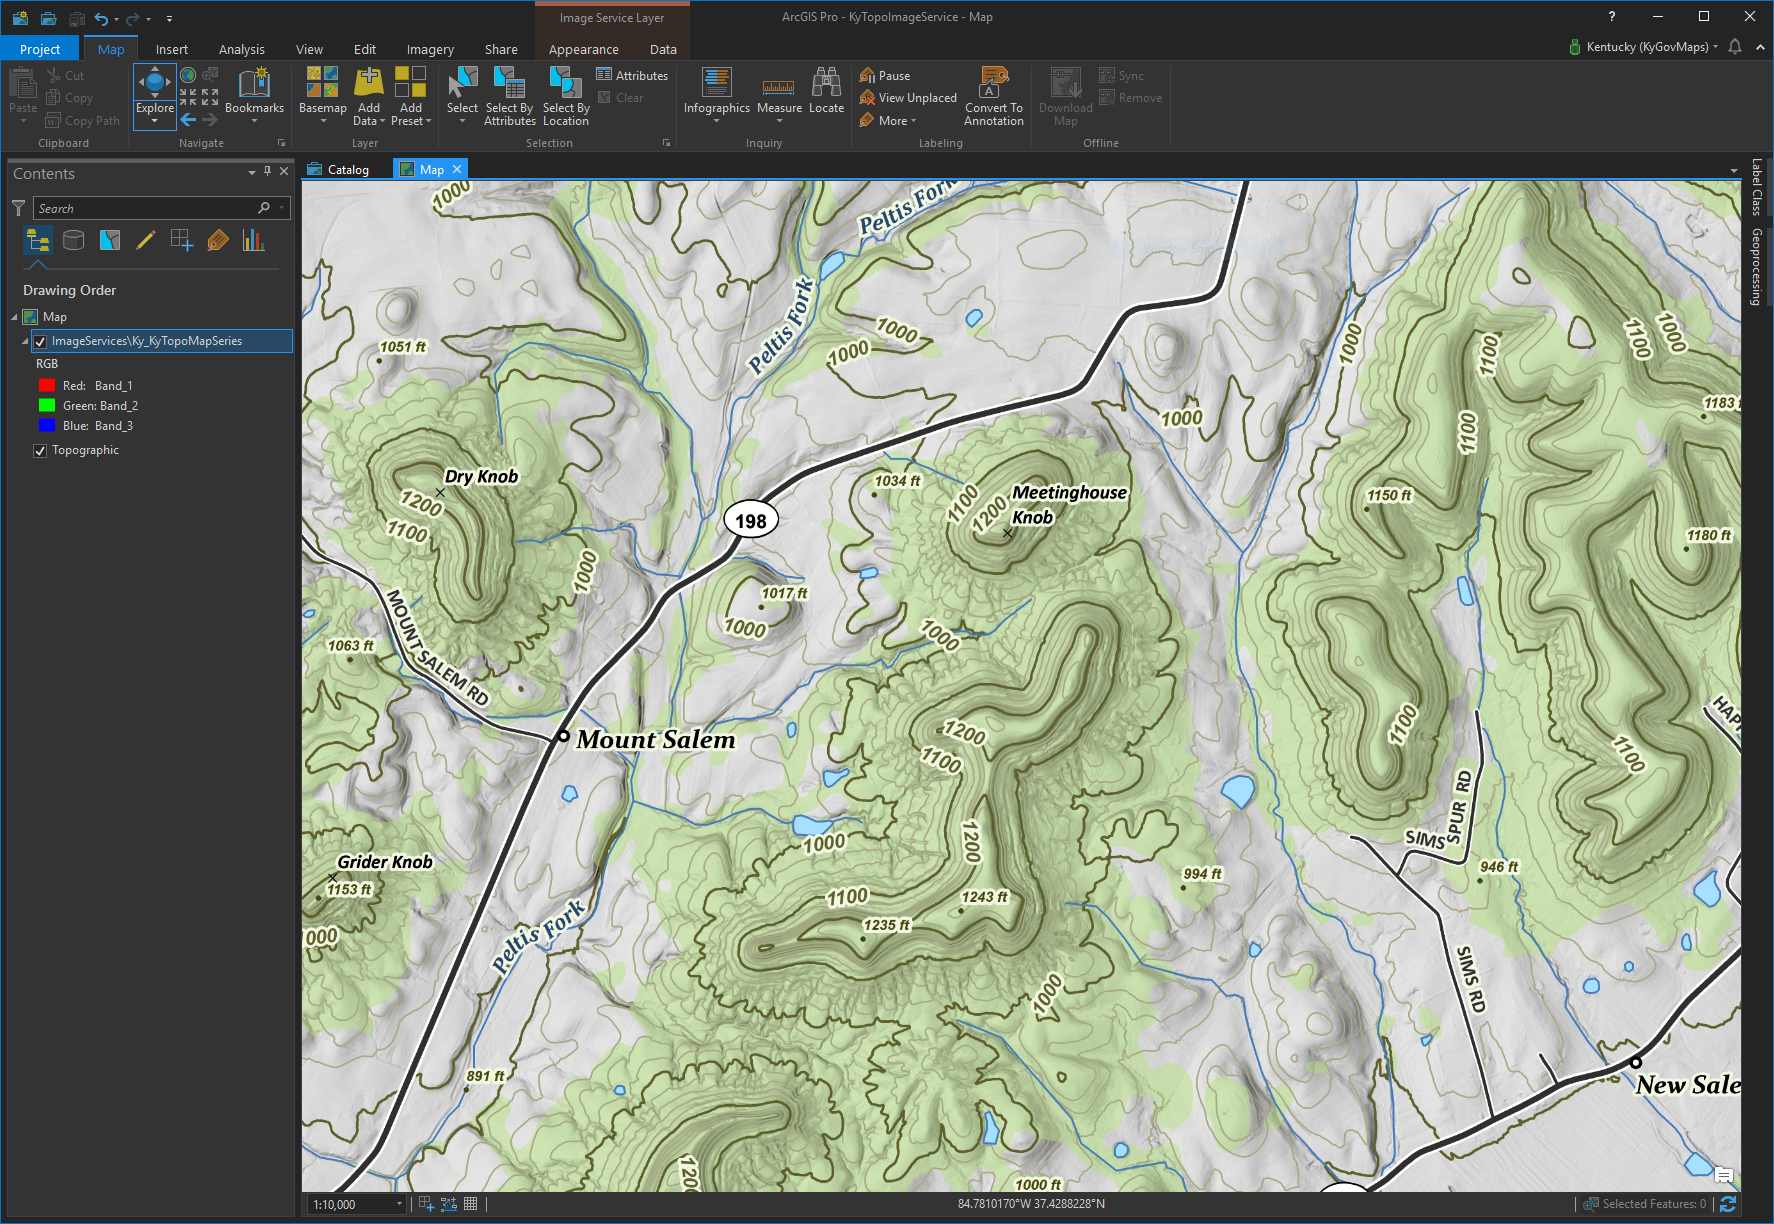
KyTopo Image Service in ArcGIS Pro (click to enlarge)
KyTopo presentations performed in the past couple months have been well received. The map series has garnered numerous positive comments relating to its readability, the landscape layout, the Kentucky-specific coordinate system, and the fact that it reflects more current ground conditions. Many are thrilled to know that it will be updated on a routine basis with the most current layers.
“The look of the topo maps delivered by the KyTopo map service is stunning. KyTopo is perfect for many of our mobile applications; providing a clean, fast, and location rich base map. The enhanced elevation data adds real value, especially in rural and rugged terrain settings. The KyTopo map service is a great addition to Kentucky’s public GIS resources.” – David Carter, PE, LS, President, CDP Engineers
Additionally, the contours used in the map series and the statewide 5’ contour feature class are now in production in the Commonwealth’s enterprise geodatabases and are available for download from the KyGeoNet. This great new resource is just one of the many valuable assets Kentucky realized through the KyFromAbove effort.
See you on the trail!
For more information, contact
Kent Anness, GIS Operations Manager
Kentucky Division of Geographic Information
kent.anness@ky.gov